
Over 25 years, going solar usually costs less than staying on the grid, but the savings depend heavily on your roof, your state, and your electric rates. A typical home solar system might cost around $19,600–$22,400 after the 30% federal tax credit and can save roughly $35,000–$45,000 in avoided utility bills over 25 years, assuming average U.S. power prices and usage. That’s like paying for about 8–10 years of electricity up front and getting the next 15+ years at a steep discount. However, if your electricity is already cheap, your roof is heavily shaded, or you can’t use tax incentives, staying on the grid may be the better financial choice.
Comparing solar vs. staying on the grid over 25 years is really a question of “pay now and save later” versus “pay as you go forever.” This guide walks through real numbers, not hype, so you can see how the math usually works out for U.S. homeowners. Whether you’re just starting to research or you’re close to getting quotes, you’ll see where solar wins, where it doesn’t, and what to check for your own home.
Table of Contents
- How the 25-Year Solar vs. Grid Comparison Works
- Key Numbers: 25-Year Solar vs. Grid Costs
- Solar vs. Grid: 3 Realistic 25-Year Scenarios
- What Affects Your 25-Year Outcome Most
- State and Utility Differences
- When Solar Clearly Beats Staying on the Grid
- When Staying on the Grid May Be Better
- Numbers and Data: Typical Solar Costs and Savings
- How to Run Your Own 25-Year Comparison
- Frequently Asked Questions
- Summary: Solar vs. Grid in One Glance
- What to Do Next
How the 25-Year Solar vs. Grid Comparison Works
What “25-year cost” really means
When you compare solar vs. staying on the grid over 25 years, you’re really comparing:
- Solar path: A big upfront investment (or financed payment) + small ongoing costs + much lower electric bills.
- Grid-only path: No big upfront cost, but a monthly electric bill that usually rises over time.
Most modern solar panels come with a 25-year performance warranty, so 25 years is a natural time frame. It’s long enough to see the full payoff, but not so long that assumptions become meaningless.
Key pieces in the comparison
To compare fairly, you need to look at:
- Total solar system cost (after incentives, including the 30% federal tax credit if you qualify).
- How much of your usage solar will cover (often 70–100% of your annual electricity).
- Your current electric rate and how fast it’s likely to rise.
- Financing costs if you’re not paying cash.
- Maintenance and inverter replacement over 25 years (usually modest, but not zero).
Once you have those, you can compare “total 25-year cost with solar” vs. “total 25-year cost staying fully on the grid.”
Key Numbers: 25-Year Solar vs. Grid Costs
Typical solar system cost vs. 25 years of utility bills
For a typical U.S. home:
- Average solar system size: 6–10 kW (about 15–25 panels).
- Cost per watt: $2.50–$3.50 installed.
- Total system cost before incentives: about $28,000–$32,000.
- After 30% federal tax credit (ITC): about $19,600–$22,400, if you can use the credit.
Now compare that to staying on the grid:
- Average U.S. electric bill: roughly $130–$150 per month, or about $1,560–$1,800 per year (varies widely by state and home size).
- 25-year cost at today’s prices: about $39,000–$45,000.
- 25-year cost with 2–3% annual rate increases: often $45,000–$55,000+.
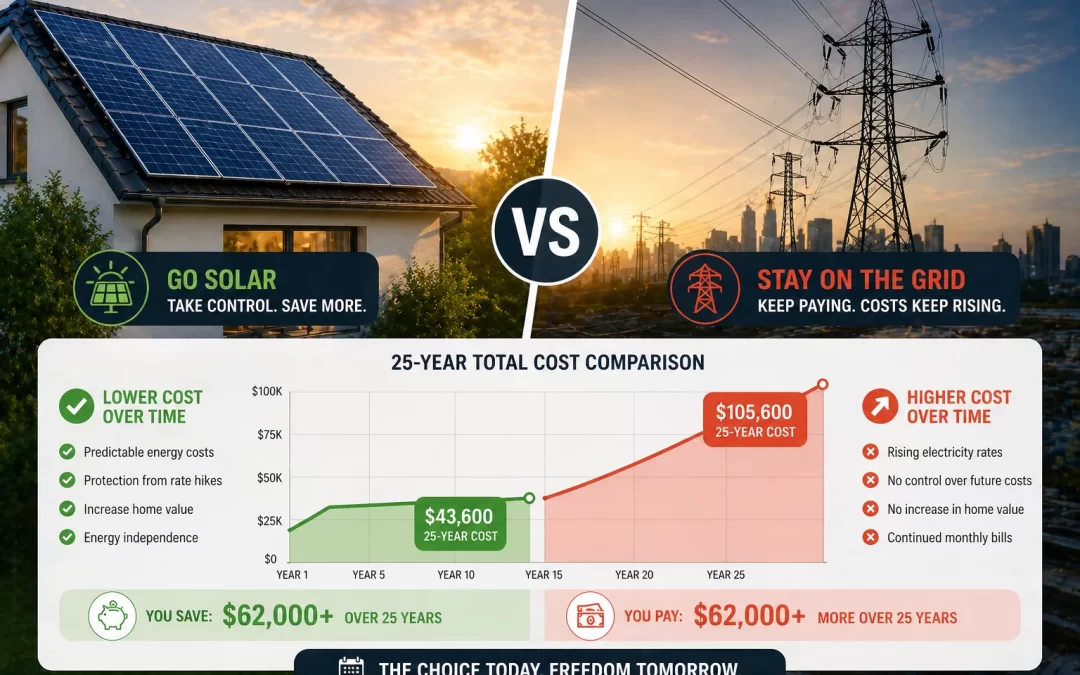
So in many cases, you’re comparing roughly $20k–$22k for solar vs. $45k–$55k for 25 years of grid power, assuming solar covers most of your usage.
Average savings and payback
Nationally, homeowners who are good candidates for solar often see:
- Average annual savings: about $1,300–$1,500 once the system is paid off (or from day one if paid in cash).
- Payback period: 7–9 years on average, faster in high-cost electricity states.
- 25-year net savings: commonly in the $20,000–$30,000+ range for solid solar locations.
Individual results vary a lot. Roof shading, local rates, and incentives can move you far above or below these averages.
Solar vs. Grid: 3 Realistic 25-Year Scenarios
Scenario 1: Strong solar state, good roof
Assumptions:
- High electric rate: $0.22/kWh, rising 2.5% per year.
- System cost after 30% ITC: $20,000.
- Solar covers 90% of usage.
Over 25 years:
- Staying on the grid: roughly $55,000–$60,000 in electric bills.
- Going solar: $20,000 upfront + maybe $2,000–$3,000 in maintenance/inverter costs + small remaining utility bills.
- Net savings: often $25,000–$35,000+ over 25 years.
In this scenario, solar is clearly cheaper over 25 years.
Scenario 2: Average state, average roof
Assumptions:
- Electric rate: $0.16/kWh, rising 2% per year.
- System cost after 30% ITC: $21,000.
- Solar covers 80% of usage.
Over 25 years:
- Staying on the grid: around $45,000–$50,000 in bills.
- Going solar: about $21,000 + $2,000–$3,000 long-term maintenance + partial utility bills.
- Net savings: often $15,000–$25,000 over 25 years.
Here, solar still usually wins, but the margin is smaller than in high-cost states.
Scenario 3: Low-cost power, poor solar conditions
Assumptions:
- Electric rate: $0.11/kWh, rising 1.5% per year.
- System cost after 30% ITC: $22,000.
- Roof is partially shaded; solar covers only 60% of usage.
Over 25 years:
- Staying on the grid: maybe $30,000–$35,000 in bills.
- Going solar: about $22,000 + $2,000–$3,000 maintenance + 40% of usage still from the grid.
- Net savings: could be small, break-even, or even negative.
In this case, solar may not be the better financial move, and staying on the grid (or exploring options like community solar) can make more sense.
What Affects Your 25-Year Outcome Most
1. Your electric rate and how fast it rises
This is often the biggest driver of 25-year savings.
- Higher starting rates = more value for each kWh your panels produce.
- Faster rate increases = bigger long-term savings from locking in your own power.
- In areas with very low, stable rates, solar’s advantage shrinks.
2. System cost and incentives
Your installed price and incentives directly change your 25-year math.
- Lower cost per watt (closer to $2.50 than $3.50) improves payback and lifetime savings.
- The 30% federal tax credit (ITC) through 2032 can reduce your net cost by nearly a third if you have enough tax liability.
- State and utility rebates, performance payments, or renewable energy credits can further improve the numbers.
Because incentives and taxes are complex, it’s wise to confirm details with a tax professional and a reputable installer.
3. How much of your usage solar can cover
Your “solar offset” is the percentage of your annual electricity that solar produces.
- Many homes target 70–100% offset.
- Shading, roof orientation, and limited roof space can reduce your offset.
- Lower offset means you still buy more power from the grid, reducing your savings.
4. Financing vs. cash
How you pay for solar changes the 25-year comparison:
- Cash purchase: higher upfront cost, but the best lifetime savings and no interest.
- Solar loan: spreads cost out; interest reduces total savings but can still beat the grid over 25 years.
- Leases/PPAs: little or no upfront cost, but you don’t own the system; savings are usually smaller and depend on contract terms.
When comparing to staying on the grid, include loan interest and any fees in your total 25-year solar cost.
5. Roof and site conditions
Your roof can make or break the economics:
- South-facing, unshaded roofs usually produce the most energy and best savings.
- Heavy shading, complex rooflines, or multiple small roof faces can increase costs and reduce production.
- If you need a new roof soon, that cost should be considered in your overall project budget.
State and Utility Differences
Why your state matters so much
Solar vs. grid economics can be excellent in one state and mediocre in another. Key differences include:
- Average electric rates (Hawaii, California, New England are high; some Midwest and Southern states are lower).
- State-level incentives and tax credits.
- Net metering or similar policies that determine how you’re credited for extra solar power sent to the grid.
To see how your state stacks up, you can review an honest, state-by-state guide to whether solar is worth it.
Utility policies and fees
Even within the same state, different utilities can change the math:
- Some offer full retail net metering; others pay less for excess solar.
- Certain utilities add fixed charges or solar-specific fees.
- Time-of-use rates (different prices at different times of day) can help or hurt depending on when your home uses power.
When you get quotes, ask installers to model your savings using your actual utility rate plan and any known upcoming changes.
When Solar Clearly Beats Staying on the Grid
Typical “solar wins” situations
Solar tends to be a strong 25-year financial choice when:
- Your electric rate is at or above the national average (around $0.16/kWh or higher).
- Your roof is mostly unshaded and faces south, southwest, or southeast.
- You can use the 30% federal tax credit and any local incentives.
- You plan to stay in your home at least 7–10 years.
- You choose a competitively priced, high-quality installer.
In these cases, it’s common to see payback in 7–9 years and 25-year savings in the tens of thousands of dollars.
Non-financial benefits that still matter
Even though this article focuses on cost, many homeowners also value:
- More predictable energy costs over decades.
- Reduced exposure to utility rate hikes.
- Environmental benefits from clean energy.
- Potential home value increase when selling (if the system is owned, not leased).
These don’t show up directly in the 25-year cost comparison but can influence your decision.
When Staying on the Grid May Be Better
Situations where solar may not make financial sense
Solar is not automatically a good deal for everyone. It may be better to stay on the grid (or consider alternatives) if:
- Your roof is heavily shaded and can’t be easily cleared.
- You have very low electric rates and low usage.
- You rent, or you’re likely to move within a few years and can’t recoup the investment.
- You can’t use the federal tax credit or local incentives, and system prices are high in your area.
- Your roof is in poor condition and would require a major upgrade that you’re not ready to do.
If several of these apply, your 25-year savings from solar may be small or negative compared to staying on the grid. In that case, it’s worth exploring options like efficiency upgrades or community solar instead of rooftop panels.
Alternatives to rooftop solar
If rooftop solar doesn’t pencil out, you still have options:
- Energy efficiency upgrades (insulation, HVAC, smart thermostats) can cut bills with no panels at all.
- Community solar lets you subscribe to a shared solar project and get bill credits without installing anything on your roof. Our guide to what community solar is and whether it’s right for you explains how it works.
- Waiting for better conditions (roof replacement, new incentives, or lower system prices) can also be reasonable.
For a deeper look at edge cases, you can read an honest breakdown of when solar doesn’t make sense and what to do instead.
Numbers and Data: Typical Solar Costs and Savings
Standard benchmarks (as of 2026)
Here are commonly cited national benchmarks for residential solar in the U.S.:
- Cost per watt: $2.50–$3.50 installed.
- Average system cost before incentives: $28,000–$32,000.
- Average system cost after 30% ITC: $19,600–$22,400 (if you qualify for the credit).
- Average annual bill savings: $1,300–$1,500.
- Payback period: 7–9 years (national average).
- Panel performance warranty: 25–30 years.
- Typical panel lifespan: 30–35 years of useful production.
- Average number of panels: 15–25 for a typical home.
These are averages, not promises. Your actual numbers will depend on your location, installer pricing, roof, and usage.
How these numbers translate into 25-year costs
Using these benchmarks, a typical 25-year comparison might look like:
- Solar path: $20,000 upfront (after ITC) + $2,000–$3,000 in long-term maintenance and inverter replacement + small remaining utility bills.
- Grid-only path: $45,000–$55,000 in electric bills over 25 years, assuming modest rate increases.
That’s why many homeowners see 25-year net savings in the $20,000–$30,000 range. But again, your situation could be better or worse than average.
What can change these numbers for you
Expect your 25-year cost comparison to shift if:
- Your installer quotes are significantly above or below $2.50–$3.50 per watt.
- Your electric rate is much higher or lower than the national average.
- You have strong state incentives or, conversely, very weak policies for solar.
- You choose premium equipment or add-ons like batteries, which increase cost but may add resilience benefits.
Before you decide, it’s smart to compare at least two or three quotes and understand exactly what equipment and warranties you’re getting. A good overview of what’s in a typical system is in this solar panels and equipment guide.
How to Run Your Own 25-Year Comparison
Step 1: Gather your current information
Start with what you already have:
- Last 12 months of electric bills (total kWh and total dollars).
- Your current electric rate per kWh.
- Any known upcoming rate changes from your utility.
- Basic roof details: age, shading, orientation, and available space.
Step 2: Estimate your solar system size and cost
Using your annual usage, an installer can size a system to offset most of your power. As a rough guide:
- Divide your annual kWh by 1,200–1,500 to estimate system size in kW (varies by location).
- Multiply kW by 1,000, then by $2.50–$3.50 to estimate a cost range before incentives.
- Apply the 30% federal tax credit if you expect to qualify (confirm with a tax professional).
For a more precise estimate and payback timeline, tools like a solar payback period calculator can help you see when panels might pay for themselves.
Step 3: Compare 25-year totals
Now compare:
- Grid-only: 25 years of bills, assuming a reasonable annual rate increase (e.g., 2–3%).
- Solar: Net system cost after incentives + estimated maintenance + remaining utility bills.
Look at:
- Payback year (when cumulative solar savings exceed your net cost).
- Total 25-year savings vs. staying on the grid.
- How sensitive the results are to changes in electric rates or system cost.
Step 4: Get multiple professional quotes
Online calculators are helpful, but real quotes are essential:
- Request at least 2–3 quotes from reputable, licensed installers.
- Ask each to model 25-year savings using your actual utility rate plan.
- Compare not just price, but equipment quality, warranties, and assumptions about rate increases.
If you’re still unsure whether solar is worth it in general, an honest “is solar worth it?” guide can help you sanity-check your expectations before you talk to installers.
Frequently Asked Questions
Is solar really cheaper than staying on the grid over 25 years?
For many U.S. homeowners, yes—solar often ends up cheaper than staying fully on the grid over 25 years, especially in states with higher electric rates. However, in areas with low power prices, heavy roof shading, or poor incentives, the savings can be small or even negative, so it’s important to run the numbers for your specific home.
How long does it take for solar panels to pay for themselves?
The national average payback period is about 7–9 years, assuming typical system costs and electric rates. In high-cost electricity states, payback can be closer to 5–7 years, while in low-cost states it might stretch beyond 10 years or not fully pay back within 25 years if conditions are poor.
What if I move before 25 years are up?
If you move, you don’t lose all the value of your solar investment—owned systems can increase home value and make your property more attractive to buyers. That said, if you expect to move within just a few years, you may not fully recover your upfront cost, so the timing of your move should factor into your decision.
Do solar panels eliminate my electric bill completely?
Most homeowners still have a small electric bill even with solar, due to fixed utility charges and times when your home uses more power than the system produces. A well-sized system can often reduce your bill by 70–100% on an annual basis, but a true $0 bill every month is not realistic for most people.
How much maintenance do solar panels need over 25 years?
Solar panels themselves are low-maintenance and usually just need occasional cleaning if dirt or debris builds up. Over 25 years, you should budget for at least one inverter replacement and possibly minor repairs, which many homeowners cover with $1,500–$3,000 set aside over the system’s life.
Does adding a battery change the 25-year cost comparison?
Yes, batteries add significant upfront cost, which can lengthen your payback period and reduce pure financial savings compared to solar alone. Many homeowners choose batteries for backup power and resilience rather than for maximum 25-year financial return.
Summary: Solar vs. Grid in One Glance
- Over 25 years, solar often costs less than staying on the grid, with typical systems around $19,600–$22,400 after the 30% federal tax credit and potential savings of $20,000–$30,000+ in many states.
- The most important factors are your electric rate, system cost, roof conditions, and whether you can use available incentives.
- Average payback is 7–9 years, with panels warrantied for 25–30 years and often lasting 30–35 years.
- Solar works best for homeowners with decent roofs, average or higher electric rates, and plans to stay put for several years.
- Your next step is to gather your bills, understand your roof, and compare multiple quotes so you can see your own 25-year numbers, not just national averages.
What to Do Next
If you’re serious about comparing solar vs. staying on the grid, the most useful thing you can do now is get a few personalized quotes based on your actual home and utility bills. Real proposals will show your expected payback, 25-year savings, and how different equipment or financing options change the numbers.
When you’re ready, you can request multiple competitive offers through our get-my-quote page and use them to decide whether solar is the right 25-year investment for your home—without any pressure to say yes.