
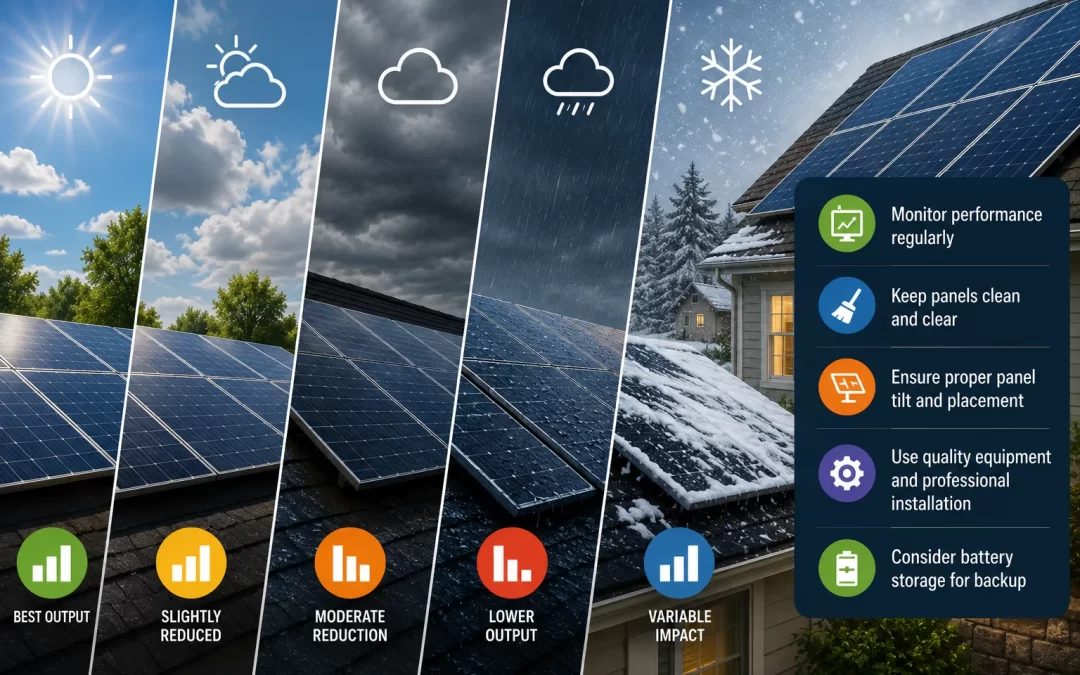
Weather affects solar panel output mainly by changing how much sunlight reaches your panels and how hot they get. Clear, cool days give you the best production, while heavy clouds, snow cover, smoke, and extreme heat can cut output anywhere from 10% to over 80% in the short term. Over a full year, most U.S. homes still get strong solar performance because sunny days balance out bad-weather days, but your exact results depend on your location and roof. You can’t control the weather, but you can choose the right system size, panel type, and installation plan to keep your energy production reliable and your savings on track.
Weather is one of the biggest variables in how much electricity your solar panels actually produce day to day. If you’re a homeowner wondering why your system seems to boom on some days and dip on others, you’re in the right place. This guide explains how different weather conditions affect solar panel output, what’s normal, what’s a red flag, and what you can realistically do about it.
Table of Contents
- How Weather Affects Solar Panel Output: The Basics
- Sunny vs. Cloudy Days: What You Can Expect
- Heat, Cold, and Temperature Effects on Solar Panels
- Rain, Snow, and Hail: Do They Help or Hurt?
- Wind, Smoke, and Dust: The Hidden Weather Factors
- Key Numbers: Costs, Savings, and Weather Risk
- Location Matters: How Your State’s Weather Changes the Math
- When Weather Works in Your Favor (and When It Doesn’t)
- What to Do Next if You’re Worried About Weather
- Frequently Asked Questions
- Summary: Key Takeaways
- Next Step: Get Weather-Smart Solar Quotes
How Weather Affects Solar Panel Output: The Basics
What this means in simple terms
Solar panels turn sunlight into electricity. Anything that changes the amount or intensity of that sunlight, or makes panels run hotter or colder, will change how much power they produce.
Weather affects solar in three main ways:
- Light level – Clouds, fog, smoke, and storms reduce how much sunlight reaches the panels.
- Temperature – Very hot panels are less efficient; cool panels are more efficient.
- Surface conditions – Snow, ice, water, or heavy dirt on the glass can block light.
Most systems are designed with local weather in mind, so occasional bad-weather days are already “baked into” your annual production estimate.
Key facts about weather and solar performance
- Modern solar panels still produce power in cloudy weather, but typically at 10–40% of their clear-sky output, depending on cloud thickness.
- Light rain usually reduces output but helps wash dust and pollen off panels, improving performance afterward.
- Snow cover can temporarily cut output by 50–100% if panels are fully covered, but snow often slides off quickly on pitched roofs.
- High heat (above ~90°F air temperature) can reduce panel efficiency by 10–25% during peak afternoon hours.
- Over a full year, most U.S. homes with well-designed systems still achieve 70–90% of their “perfect weather” potential because good days outweigh bad ones.
What affects how much weather impacts your system
- Your location (sunny Southwest vs. cloudy Northwest)
- Roof tilt and direction (south-facing vs. east/west vs. shaded)
- Panel type and efficiency (premium vs. budget panels)
- Mounting and airflow (flush to roof vs. well-ventilated racking)
- Local climate patterns (frequent snow, monsoon clouds, wildfire smoke)
When you get a professional solar quote, the installer should use local weather data (called “solar irradiance” and “typical meteorological year” data) to estimate your annual production realistically.
Sunny vs. Cloudy Days: What You Can Expect
How much do clouds really reduce solar output?
On a clear, sunny day around noon, your system will usually hit its highest power output. On cloudy days, output drops, but it rarely goes to zero unless it’s extremely dark or stormy.
- Light clouds / hazy sky: Expect about 70–90% of normal production.
- Broken clouds: Output may swing between 30–100% as clouds pass.
- Thick overcast: Often 10–40% of sunny-day output.
- Storms / very dark skies: Production can drop to 5–10% of normal.
Interestingly, when the sun peeks around clouds, panels can briefly produce slightly more than their rated power because of “edge-of-cloud” effects that concentrate light.
Real-world homeowner scenarios
- “My system produced half as much this week as last week.”
That’s often normal if you had a stretch of cloudy or rainy days. Look at your monitoring app over a full month, not just a few days. - “My neighbor’s system seems to do better on cloudy days than mine.”
Roof direction, shading, and system size can all explain this. It’s not always an equipment problem.
When clouds are a concern vs. when they’re normal
Normal weather impact:
- Production dips on cloudy days but rebounds on sunny days.
- Your monthly total still roughly matches your installer’s estimate (within about ±10–15%).
Possible problem:
- Production is consistently low on both sunny and cloudy days.
- Your system is making far less than expected over several months.
If you suspect an issue, start with your monitoring app and compare to your original estimate. If the gap is large, our guide on why solar systems produce less than expected can help you troubleshoot next steps.
Heat, Cold, and Temperature Effects on Solar Panels
Why hot panels make less power
Solar panels are tested at 77°F (25°C), but your roof can get much hotter than that. As panel temperature rises, their voltage drops, which slightly reduces power output.
- Most panels lose about 0.3–0.5% efficiency per °C above 25°C (77°F).
- On a 100°F day, panel surface temperatures can reach 140–160°F.
- This can reduce real-time output by roughly 10–25% compared to the same sunlight at cooler temperatures.
So, ironically, the sunniest, hottest afternoons of summer may not be your most efficient hours, even though they still produce a lot of energy overall.
Cold weather: surprisingly good for solar
Cold, clear days are actually ideal for solar panels. The air is often crisp, and panels run cool and efficient.
- On a sunny winter day with no snow cover, panels can perform better than their rated output for short periods.
- Shorter winter days mean fewer total hours of sun, but each hour can be very productive.
What you can do about temperature effects
- Choose quality equipment: Premium panels often have better temperature coefficients (they lose less efficiency as they heat up).
- Ensure good airflow: Panels mounted with a small gap above the roof allow air to circulate and cool them.
- Consider light-colored roofing if you’re re-roofing: It can reduce roof temperature slightly.
Temperature effects are normal and already included in professional production estimates, so they rarely change the overall value of going solar—just the hour-by-hour output profile.
Rain, Snow, and Hail: Do They Help or Hurt?
Rain: short-term dip, long-term benefit
Rainy days reduce sunlight, so your production drops while it’s raining. But rain also acts like a free cleaning service.
- During rain: Expect output to fall to 10–40% of sunny-day levels, depending on cloud thickness.
- After rain: Cleaned panels can produce 3–10% more than they did when dusty or covered in pollen.
In many climates, regular rain means you rarely need to manually clean your panels. In drier, dusty areas, occasional cleaning still helps; see our guide on how to clean solar panels and how often you actually need to.
Snow: when it matters and when it doesn’t
Snow affects solar in two ways: by blocking light when it’s on the panels, and by reflecting extra light when it’s on the ground.
- Light dusting: Often melts or slides off quickly; minor impact.
- Moderate snow: Can temporarily reduce output by 50–100% until it slides off.
- Heavy, wet snow: May stick longer, especially on low-slope roofs, causing several days of low production.
In many parts of the U.S., annual production loss from snow is under 5%. In very snowy regions with low-tilt roofs, it can be higher, but installers can model this using local data. For more detail, see our guide on how solar panels perform in winter, snow, and cold.
Should you clear snow off your panels?
For most homeowners, the answer is no—at least not by climbing on the roof.
- Panels are slippery and often clear themselves as the sun warms them.
- The safety risk of going on a snowy roof usually outweighs the value of a few days of extra production.
- If you must clear snow, use a soft, non-abrasive roof rake from the ground and avoid damaging the glass or wiring.
Hail and storm damage
Quality solar panels are tested to withstand hail up to about 1-inch diameter at 50+ mph, but extreme hail can still cause damage.
- Most hailstorms do not damage panels.
- If you see cracked glass or a sudden unexplained drop in production after a storm, contact your installer and your homeowner’s insurance.
- Storm damage may be covered under your solar panel warranty and homeowner’s policy, but coverage varies.
Wind, Smoke, and Dust: The Hidden Weather Factors
Wind: mostly helpful, sometimes risky
Wind itself doesn’t reduce solar output; in fact, it often helps by cooling panels.
- Moderate wind: Improves airflow and can slightly boost efficiency.
- High winds / storms: The main concern is physical damage to the roof or mounting system, not day-to-day output.
Properly installed systems are engineered to meet local wind codes, but if you live in a hurricane- or tornado-prone area, discuss mounting methods and wind ratings with your installer.
Smoke, smog, and wildfire haze
In recent years, wildfire smoke has become a real factor in some regions. Smoke and heavy smog act like very thick clouds, reducing the intensity of sunlight.
- During heavy smoke events, output can drop by 20–50% or more.
- Fine ash and soot can also settle on panels, further reducing production until the next rain or cleaning.
- In most areas, this is a short-term issue and doesn’t dramatically change long-term savings, but in fire-prone regions it should be part of your expectations.
Dust, pollen, and dirt buildup
Dry, dusty climates or areas with heavy pollen can see gradual performance loss over time if panels aren’t cleaned.
- Typical soiling losses are around 2–8% per year in many areas.
- In very dusty or agricultural regions, losses can be higher without cleaning.
- Light rain may not fully remove sticky pollen or grime; occasional manual cleaning can restore output.
Key Numbers: Costs, Savings, and Weather Risk
Typical system cost and savings (with weather already included)
When installers estimate your solar production and savings, they use long-term weather data for your area. That means typical clouds, rain, snow, and temperature swings are already factored into the numbers below.
- Average system cost (before incentives): $28,000–$32,000 for a typical U.S. home.
- Average cost per watt: About $2.50–$3.50, depending on equipment and location.
- Federal solar tax credit (ITC): Currently 30% of eligible system costs through 2032 (consult a tax professional to confirm your eligibility).
- Average net cost after 30% ITC: Roughly $19,600–$22,400.
- Average annual bill savings: Around $1,300–$1,500, assuming typical weather and utility rates.
- Typical payback period: About 7–9 years nationally, with panels lasting 25–30 years under warranty and often 30–35 years in practice.
- Average number of panels: Usually 15–25 panels for a standard home, depending on panel wattage and your energy use.
Your actual numbers will vary based on your state, utility rates, roof, shading, and incentives. Weather is just one piece of the puzzle, and it’s already built into professional production models.
How weather can shift these numbers
- Very sunny climates (Arizona, Nevada, Southern California) often see shorter payback periods because of higher annual production.
- Cloudier climates (Pacific Northwest, parts of the Midwest and Northeast) may have slightly longer payback periods, but still often fall in the 8–12 year range.
- Snowy regions may lose some winter production but often gain from bright, reflective snow and cool temperatures on clear days.
To see how weather interacts with your utility rates and roof, it helps to review a detailed quote and compare it with your long-term goals. Our solar cost and savings guide explains how to interpret those numbers.
Location Matters: How Your State’s Weather Changes the Math
High-sun vs. low-sun regions
Solar potential is often measured in “peak sun hours” per day—essentially, how many hours of strong, direct sunlight you get on average.
- High-sun states (CA, AZ, NV, NM, TX, FL): Often get 5–7 peak sun hours/day.
- Moderate-sun states (CO, UT, KS, OK, NC, GA): Around 4–5.5 peak sun hours/day.
- Lower-sun states (WA, OR, NY, VT, OH, MI): Often 3–4.5 peak sun hours/day.
Even in lower-sun states, long summer days and modern panel efficiency make solar viable for many homes, especially where electricity is expensive.
Seasonal swings you should expect
- Summer: Long days, higher sun angle, more total production—but some efficiency loss from heat.
- Winter: Shorter days, lower sun angle, potential snow cover—but excellent panel efficiency on clear days.
- Spring/Fall: Often the “sweet spot” with mild temperatures and decent sun.
It’s normal for your winter production to be 30–60% lower than your summer production, depending on your latitude and weather patterns.
When location might make solar less attractive
Solar may be less compelling if:
- You live in a very cloudy, low-sun region and your electricity rates are low.
- Your roof has heavy shading from trees or nearby buildings that can’t be removed.
- Your roof faces mostly north and there’s no good place for ground mounts.
In those cases, it’s still worth getting quotes, but you’ll want to look closely at the projected payback period and total savings. Our honest “Is solar worth it?” guide walks through when solar does and doesn’t make sense.
When Weather Works in Your Favor (and When It Doesn’t)
Weather patterns that help solar homeowners
- Cool, sunny climates: Maximize panel efficiency and annual production.
- Regular light rain: Keeps panels relatively clean without much effort.
- Bright winter days with snow on the ground: Snow reflects extra light onto panels, boosting output.
- Steady, predictable seasons: Make it easier to match your solar production to your energy use.
Weather patterns that can hurt solar performance
- Frequent heavy overcast or marine layer clouds that persist for much of the day.
- Long periods of wildfire smoke or heavy smog that block sunlight.
- Persistent snow cover on low-tilt roofs that doesn’t slide off easily.
- Extreme heat waves that push panel temperatures very high for weeks at a time.
How to protect yourself from weather-related disappointment
- Insist on realistic production estimates based on local weather data, not just “perfect sun” assumptions.
- Ask for best-case, typical, and worst-case scenarios so you understand the range of possible outcomes.
- Review your installer’s performance guarantee, if they offer one, and understand what’s covered.
- Plan your budget assuming “typical” weather, not the sunniest year on record.
What to Do Next if You’re Worried About Weather
If you already have solar and think weather is hurting your output
- Check your monitoring app over at least a full month, not just a few days.
- Compare to your original estimate from the installer—small swings are normal; big gaps may not be.
- Look for patterns: Is production low only on bad-weather days, or also on clear, sunny days?
- Inspect from the ground for visible issues: snow cover, debris, shading from new tree growth.
- If something seems off, our guide on how to monitor your solar system’s performance can help you dig deeper before calling your installer.
If you’re still deciding whether to go solar
- Gather your last 12 months of electric bills so a designer can model your usage and local weather together.
- Note your roof details: direction (south, east, west), shading, and roof age.
- Ask each installer:
- What weather data did you use for my production estimate?
- How much annual variation should I expect from weather alone?
- How do snow, smoke, or storms typically affect systems in my area?
- Get multiple quotes so you can compare how different companies model weather and production.
When it makes sense to act now
- Your roof is in good shape and you plan to stay in your home for at least 7–10 years.
- Your utility rates are high or rising, and your area gets a reasonable amount of sun.
- You’re comfortable with some year-to-year variation in production due to weather, as long as the long-term trend is strong.
If you’re in a very cloudy or extreme-weather area, it’s still worth getting quotes—you just need to look more carefully at the assumptions and payback period.
Frequently Asked Questions
Do solar panels work on cloudy days?
Yes, solar panels still work on cloudy days, but they produce less electricity. Depending on how thick the clouds are, you might see anywhere from about 10% to 60% of your normal sunny-day output, with most typical overcast days landing in the 20–40% range.
How much does rain affect solar panel output?
Rainy days usually reduce solar production to around 10–40% of what you’d get on a clear day because of heavy cloud cover. However, rain also helps wash away dust and pollen, which can slightly improve your panels’ performance once the skies clear.
Will snow on my solar panels ruin my savings?
Short-term, snow can block sunlight and temporarily cut output by 50–100% if panels are fully covered. Over a full year, though, most U.S. systems lose less than about 5% of their total production to snow, and this impact is usually included in your installer’s estimates.
Do solar panels work better in hot or cold weather?
Solar panels actually work more efficiently in cooler temperatures, as long as there is good sunlight. Hot weather still produces plenty of energy because the sun is strong, but very high panel temperatures can reduce efficiency by 10–25% compared to cooler days.
How does wildfire smoke affect solar panel output?
Wildfire smoke can significantly reduce solar output by blocking and scattering sunlight, sometimes cutting production by 20–50% or more during heavy smoke events. Ash and soot can also settle on panels, so cleaning or a good rain afterward can help restore performance.
Is solar still worth it in a cloudy state?
In many cloudy states, solar can still be worth it because long summer days and modern panel efficiency offset lower winter sun. The key is your local electricity rates, available incentives, and roof conditions—so it’s important to review detailed quotes and payback estimates for your specific home.
Summary: Key Takeaways
- Weather affects solar panel output by changing sunlight levels, temperature, and panel surface conditions, but typical patterns are already built into professional production estimates.
- Clouds, rain, and snow can cut output by 10–80% on bad days, yet most U.S. systems still deliver strong annual performance and typical savings of about $1,300–$1,500 per year.
- Your location, roof direction, shading, and local climate have more impact on long-term results than any single storm or cloudy week.
- Solar remains a long-term investment: with 25–30 year performance warranties and 7–9 year average payback, occasional bad-weather days don’t usually break the math.
- The smartest next step is to get weather-aware quotes that use local data and clearly explain best-case, typical, and worst-case production scenarios for your home.
Next Step: Get Weather-Smart Solar Quotes
Every home and climate is different, and the only way to know how weather will affect your solar savings is to see personalized estimates based on your roof and local data. Getting multiple quotes lets you compare how different installers model weather, production, and long-term savings side by side.
If you’re ready to see real numbers for your home, you can start by getting customized solar quotes at /get-my-quote/. There’s no obligation, and you’ll be in a much better position to decide whether solar makes sense for you given your local weather and energy costs.