
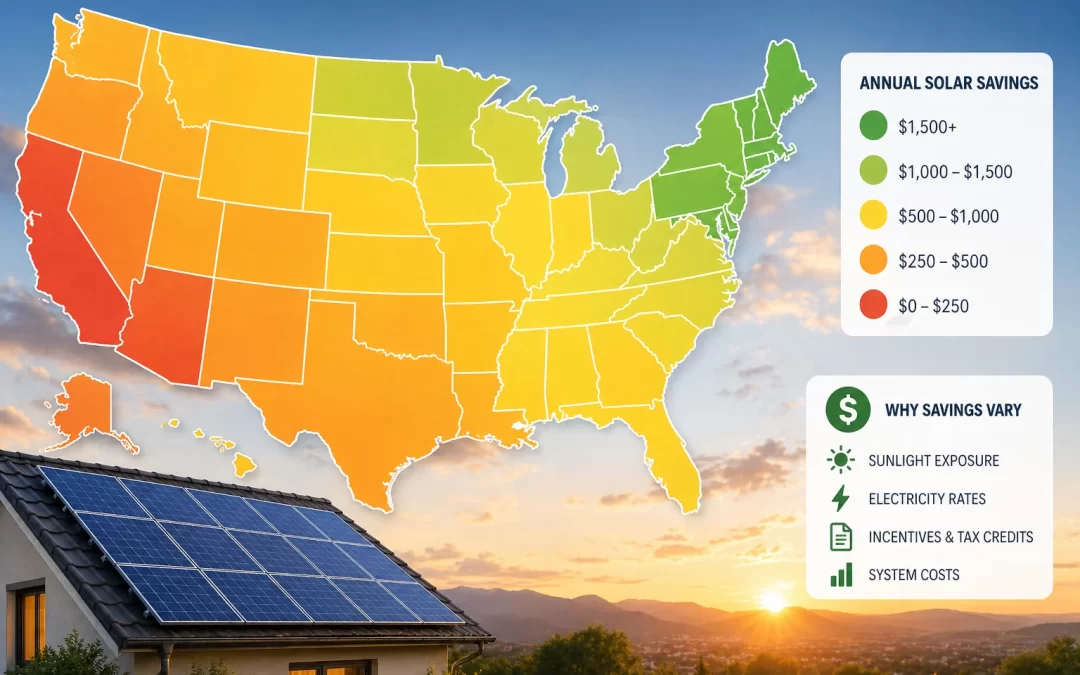
Solar cost and savings vary widely by state, but homeowners usually save the most in places with high electricity rates, strong sunshine, and good incentives — states like California, New York, Massachusetts, New Jersey, Arizona, and Nevada. In many of these states, a typical solar system can pay for itself in about 6–8 years and save $25,000–$40,000 over 25–30 years. In lower-cost electricity states, payback can stretch closer to 10–12 years, but long-term savings are still common. Your actual results depend on your roof, energy use, local rates, and which incentives you qualify for.
Solar cost by state is one of the biggest factors in whether panels make financial sense for your home. This guide breaks down where solar saves the most money, what drives those differences, and how to estimate your own savings. It’s written for U.S. homeowners who want clear, honest numbers before talking to an installer.
Table of Contents
- Why Solar Cost and Savings Vary So Much by State
- National Solar Cost and Savings: Key Numbers to Know
- Best States for Solar Savings
- States Where Solar Payback Is Slower
- What Drives Solar Cost and Savings in Your State?
- How to Estimate Your Solar Savings by State
- When Solar Works in Your Favor — and When It Doesn’t
- Numbers & Data: What Most Homeowners Actually See
- How to Decide What to Do Next
- Frequently Asked Questions
- Summary: Solar Cost by State in a Nutshell
Why Solar Cost and Savings Vary So Much by State
Two neighbors in different states can install the same size solar system and end up with very different savings. That’s because your state affects both what you pay for solar and how much you save on your electric bill.
Key reasons your state matters
Solar cost by state is shaped by a few big factors:
- Electricity rates: Higher utility rates mean every kilowatt-hour (kWh) your panels produce is worth more.
- Sunshine levels: Sunny states need fewer panels to produce the same energy, improving payback.
- State and local incentives: Rebates, tax credits, and performance payments can cut thousands off your cost.
- Net metering rules: These determine how you’re credited for extra power you send back to the grid.
- Local labor and permitting costs: These can raise or lower the installed price per watt.
What this means for homeowners
- In high-cost, sunny states with good incentives, solar can be a “no-brainer” financially.
- In low-cost electricity states with weak incentives, solar can still pay off, but over a longer timeline.
- Even within a state, your utility company’s rates and policies can change the math.
If you’re still deciding whether solar makes sense at all, our honest solar worth-it guide walks through the main variables in more detail.
National Solar Cost and Savings: Key Numbers to Know
Before comparing solar cost by state, it helps to know the national averages. These give you a baseline to see whether your state is better or worse than typical.
Typical residential solar system costs (U.S. averages)
- Cost per watt: $2.50–$3.50 per watt (before incentives)
- Typical system size: 6–10 kW for a single-family home
- Average system cost: $28,000–$32,000 before incentives
- After 30% federal tax credit: About $19,600–$22,400 (if you qualify)
- Average panels needed: 15–25 panels, depending on panel wattage and your usage
These numbers are typical for 2026 but can vary by installer, equipment, and location. For a deeper breakdown by system size, see the average solar panel cost by system size guide.
Typical savings and payback
- Average annual bill savings: $1,300–$1,500 nationally
- National average payback period: 7–9 years
- Panel performance warranty: 25–30 years
- Typical panel lifespan: 30–35 years of useful production
In high-cost electricity states, annual savings can be much higher and payback shorter. In low-cost states, savings are lower and payback longer, but panels still often outlast the payback period by 15–20 years.
Best States for Solar Savings
States where solar saves the most money usually share three traits: high electricity prices, strong sunshine, and decent incentives or net metering. While exact rankings change over time, several states consistently come out ahead.
States where solar often pays back in 6–8 years
These states typically offer strong long-term savings for homeowners who own their systems:
- California: Very high electricity rates and strong sun. Net metering has become less generous, but savings can still be substantial for high-usage homes.
- New York: High utility rates, solid state incentives in many areas, and decent sun, especially downstate.
- Massachusetts: High rates, good incentives, and supportive policies have historically made solar very attractive.
- New Jersey: High rates, good sun, and performance-based incentives in many utility territories.
- Arizona: Excellent sun and relatively high summer rates, especially for heavy AC users.
- Nevada: Very strong sun and improving net metering rules in many areas.
- Connecticut and Rhode Island: High electricity prices and supportive state programs.
In these states, it’s common for homeowners to:
- Recover their upfront cost in 6–8 years (sometimes faster for high-usage homes).
- See lifetime savings of $25,000–$40,000+ over 25–30 years.
- Offset 70–100% of their annual electricity usage with a properly sized system.
Why these states stand out
- High electricity rates: Often $0.20–$0.35 per kWh or more in parts of CA, NY, MA, CT, RI, and NJ.
- Good sun: Southwest states like AZ and NV can produce more energy per panel than cloudier regions.
- State incentives: Many of these states offer rebates, tax credits, or performance payments on top of the 30% federal tax credit.
- Net metering or similar programs: These allow you to earn credits for extra power you send to the grid, improving your savings.
When solar shines brightest in these states
Solar tends to be especially strong financially if:
- Your utility rate is above the state average.
- You use a lot of power (electric heating, pool pumps, EV charging, or large homes).
- You have a mostly unshaded, south- or west-facing roof.
- You can use the full 30% federal tax credit and any state incentives (talk to a tax professional to confirm).
States Where Solar Payback Is Slower
Some states have lower electricity prices, fewer incentives, or weaker net metering rules. Solar can still make sense, but the payback period is usually longer.
States with slower payback (often 9–12+ years)
Examples include many parts of:
- Midwest states: Indiana, Ohio, Iowa, Kansas, Missouri, and others with relatively low electricity rates.
- Southern states with cheap power: Kentucky, Tennessee, parts of Texas (depending on utility), and some Gulf states.
- States with limited incentives or weaker net metering: Policies change often, but some states offer fewer financial supports than others.
In these states, typical outcomes might be:
- Payback periods in the 9–12+ year range.
- Lifetime savings still in the $10,000–$25,000 range over 25–30 years, depending on rate increases.
- More sensitivity to changes in utility policies and rate structures.
Why solar can still be worth it in slower-payback states
- Rates tend to rise over time: Even if rates are low now, long-term increases improve your savings.
- Long panel life: With 25–30 year performance warranties, you can enjoy many years of “free” power after payback.
- Home value boost: Owned solar systems often increase resale value, which can offset a longer payback timeline.
To understand the home value side, see how much solar adds to home value.
When solar may not be the best move in these states
Solar might not be ideal if:
- Your electricity rate is very low and unlikely to rise much.
- Your roof is heavily shaded or needs major work soon.
- You can’t use the federal tax credit or local incentives.
- Your utility has very unfavorable policies for solar exports.
What Drives Solar Cost and Savings in Your State?
Even within the same state, two homeowners can see very different results. Here are the main levers that change solar cost and savings by state and by household.
1. Electricity price and rate structure
- Base rate per kWh: The higher your rate, the more each kWh of solar production is worth.
- Time-of-use (TOU) rates: In some states, power is more expensive at certain times (like late afternoon and evening). Solar that offsets those hours is especially valuable.
- Tiered rates: Some utilities charge more per kWh after you pass a certain usage threshold, making solar more valuable for high-usage homes.
2. Sunshine and climate
- Solar resource: States in the Southwest (AZ, NV, NM, CA) get more annual sun than the Northeast or Pacific Northwest.
- Production per kW: A 7 kW system in Arizona can produce significantly more energy per year than the same system in Michigan.
- Snow and weather: Snowy or cloudy climates still work for solar, but annual production is lower, which lengthens payback.
3. State and local incentives
Beyond the 30% federal tax credit (available through 2032), some states and utilities offer:
- Upfront rebates: Direct discounts on system cost.
- State tax credits: Credits against your state income tax.
- Performance payments: Payments based on how much energy your system produces.
- Sales and property tax exemptions: Reducing taxes on equipment and added home value.
These can easily shift payback by several years. For a deeper dive into incentives, see the solar incentives and tax credits guide, and always confirm details with a tax professional.
4. Net metering and export credits
Net metering is the policy that determines how you’re credited for extra solar energy you send back to the grid.
- Full retail net metering: You get a 1:1 credit at your retail rate — best for savings.
- Reduced export rates: You’re credited at a lower rate than you pay; this reduces savings but can still be worthwhile.
- Time-based credits: Some states credit exports differently depending on the time of day.
5. Local installation costs
- Labor costs: Higher in some metro areas and coastal states.
- Permitting and interconnection fees: Can add hundreds to thousands to a project.
- Market competition: States with many installers often have more competitive pricing.
How to Estimate Your Solar Savings by State
Even without a quote, you can get a rough idea of your potential savings based on where you live and how much power you use.
Step 1: Look at your electric bill
- Find your average monthly usage in kWh (often listed as “kWh used”).
- Find your effective rate by dividing your total bill by your kWh used (for example, $150 ÷ 800 kWh = $0.19/kWh).
- Multiply your monthly usage by 12 to get your annual usage.
Step 2: Estimate system size
A rough rule of thumb for many states:
- Each installed kilowatt (kW) of solar can produce about 1,200–1,600 kWh per year, depending on your state’s sun.
- System size (kW) ≈ Annual usage ÷ (1,200–1,600).
Example: If you use 10,000 kWh per year and live in a sunny state (1,500 kWh per kW):
- 10,000 ÷ 1,500 ≈ 6.7 kW system.
Step 3: Estimate system cost in your state
- Use the national range of $2.50–$3.50 per watt as a starting point.
- Multiply by your estimated system size in watts (kW × 1,000).
Example (6.7 kW system):
- 6,700 watts × $3.00/watt ≈ $20,100 before incentives.
- After 30% federal tax credit: $20,100 × 0.70 ≈ $14,070 (if you qualify).
Step 4: Estimate annual savings
- Estimate how many kWh your system will produce annually (system size × 1,200–1,600 kWh per kW).
- Multiply by your effective rate per kWh.
Example (6.7 kW in a sunny state at $0.20/kWh):
- 6.7 kW × 1,500 kWh ≈ 10,050 kWh/year.
- 10,050 × $0.20 ≈ $2,010/year in bill savings.
Step 5: Estimate payback period
- Payback (years) ≈ Net system cost ÷ Annual savings.
Using the example above:
- $14,070 ÷ $2,010 ≈ 7 years payback.
This is a simplified model, but it shows how your state’s sun and electricity rate directly affect your solar payback.
When Solar Works in Your Favor — and When It Doesn’t
Solar cost by state is only part of the story. Your personal situation matters just as much as your ZIP code.
When solar usually works very well
- You live in a state with above-average electricity rates (often $0.16/kWh or higher).
- Your roof has good sun exposure (minimal shading, south or west orientation).
- You plan to stay in your home for at least 5–7 years.
- You can take advantage of the 30% federal tax credit and any state incentives (confirm with a tax professional).
- You choose to own your system (cash or loan), so you keep the long-term savings.
When solar can still work, but the math is tighter
- You live in a state with moderate electricity rates and average sun.
- Your roof has some shading, but not severe.
- You may move in 5–7 years but are in a strong real estate market where solar adds value.
- You use financing with a reasonable interest rate and no major fees.
When solar may not be the right choice (for now)
- Your electricity rate is very low and your usage is modest.
- Your roof is heavily shaded, faces mostly north, or is too small for enough panels.
- Your roof needs major work soon, and you’re not ready to replace it yet.
- You can’t use the federal tax credit or local incentives, and your state has weak net metering.
- You’re planning to move within 2–3 years and your local market doesn’t strongly value solar yet.
If you’re unsure which bucket you fall into, our solar cost and savings guide walks through more detailed scenarios.
Numbers & Data: What Most Homeowners Actually See
Here’s how the national averages stack up against what homeowners in different types of states often experience.
National baseline (all states combined)
- System cost: $28,000–$32,000 before incentives; $19,600–$22,400 after 30% federal tax credit.
- Cost per watt: $2.50–$3.50.
- Average annual savings: $1,300–$1,500.
- Payback period: 7–9 years.
- Panel lifespan: 25–30 years performance warranty; 30–35 years typical life.
- Panels needed: 15–25 for a typical U.S. home.
High-savings states (CA, MA, NJ, NY, AZ, NV, etc.)
- System cost: Often similar or slightly higher than national average, but more incentives available.
- Annual savings: Commonly $1,800–$2,500+, especially for high-usage homes.
- Payback period: Frequently 6–8 years, sometimes faster.
- Lifetime savings: Often $25,000–$40,000+ over 25–30 years.
Moderate-savings states (many Midwest, Mid-Atlantic, and Southern states)
- System cost: Often near the national average, sometimes slightly lower.
- Annual savings: Typically $900–$1,500, depending on rates and sun.
- Payback period: Around 8–11 years.
- Lifetime savings: Often in the $15,000–$30,000 range over 25–30 years.
Lower-savings states (very low rates or weak policies)
- System cost: Similar to national averages, but fewer incentives.
- Annual savings: Sometimes $700–$1,200.
- Payback period: 10–14+ years, depending on rate increases.
- Lifetime savings: Still often positive, but more modest.
These are broad ranges, not guarantees. Your actual numbers will depend on your usage, roof, equipment choices, financing, and local policies. That’s why personalized quotes are so important.
How to Decide What to Do Next
Once you understand how solar cost and savings vary by state, the next step is deciding whether to move forward — and how.
Is now a good time to act?
- The 30% federal tax credit is locked in through 2032, but state incentives can change quickly.
- Equipment costs have stabilized, and many markets are competitive, which helps pricing.
- If your state has strong incentives or favorable net metering today, waiting could mean missing out if policies tighten.
Information to gather before getting quotes
- Your last 12 months of electric bills (or at least 3–6 months).
- Basic details about your roof: age, material (asphalt, tile, metal), and any shading issues.
- Your long-term plans: how long you expect to stay in the home.
- Your preferences on paying cash vs. financing vs. leasing.
Questions to ask potential installers
- “Based on my usage and utility, what’s my estimated payback period?”
- “How much will my bill be after solar in a typical month and in peak seasons?”
- “What assumptions are you using for electricity rate increases?”
- “What incentives are available in my state and utility territory, and who handles the paperwork?”
- “What equipment are you using, and what are the warranties on panels, inverters, and workmanship?”
- “How do you handle roof issues or leaks after installation?”
Why getting multiple quotes matters
- Pricing can vary by thousands of dollars for the same size system.
- Different installers may propose different system sizes or equipment based on your state’s sun and policies.
- You’ll get a clearer picture of your realistic payback and savings in your specific state and utility.
Before you compare quotes, it can help to understand your options for ownership and financing; our guide to solar loans vs. leases vs. PPAs explains the trade-offs in plain language.
Frequently Asked Questions
Which state has the cheapest solar panels?
Solar equipment prices are fairly similar nationwide, but total installed cost per watt can be lower in states with lots of competition and streamlined permitting, such as parts of California, Texas, and Florida. However, the “cheapest” system isn’t always the best value — long-term savings depend more on your electricity rate, sun, and incentives than on a small difference in upfront cost.
Which state saves the most money with solar?
States like California, Massachusetts, New Jersey, New York, Arizona, and Nevada often deliver the highest lifetime savings because they combine high electricity rates with good sun and, in many cases, strong incentives. In these states, it’s common for homeowners to save $25,000–$40,000 or more over 25–30 years with a well-sized system.
Is solar worth it in low electricity cost states?
Solar can still be worth it in low-cost states, but payback is usually longer — often 10–12+ years instead of 6–8. The decision comes down to your usage, roof, how long you’ll stay in the home, and whether you value long-term bill protection even if the short-term savings are smaller.
How does net metering affect solar savings in my state?
Net metering determines how you’re credited for extra power your panels send back to the grid, and it can significantly change your savings. States with full retail net metering usually offer faster payback, while states with reduced export rates still offer savings but may require more careful system sizing and usage planning.
Do solar incentives differ by state?
Yes, solar incentives vary widely by state and even by utility. Some states offer additional tax credits, rebates, or performance payments on top of the 30% federal tax credit, while others offer very little; always check current programs in your area and confirm details with a tax professional.
How can I find out my exact solar savings in my state?
The most reliable way is to get personalized quotes from reputable installers who work in your state and utility territory. They can model your roof, usage, local rates, and incentives to give you a state-specific payback and savings estimate.
Summary: Solar Cost by State in a Nutshell
- Solar cost by state is influenced mainly by electricity rates, sunshine, incentives, and local policies like net metering.
- Nationally, a typical system costs about $28,000–$32,000 before incentives and $19,600–$22,400 after the 30% federal tax credit, with a 7–9 year average payback.
- High-rate, sunny states with good incentives (CA, MA, NJ, NY, AZ, NV, and others) often see paybacks of 6–8 years and lifetime savings of $25,000–$40,000+.
- Lower-rate states usually have longer paybacks, but panels still often produce 15–20 years of “free” power after breakeven.
- Your personal roof, usage, and local utility rules matter as much as your state, so getting multiple tailored quotes is the best next step.
If you’re ready to see real numbers for your home — in your state, with your roof and utility — getting personalized quotes is the most reliable way to decide. Compare offers from vetted installers and see your projected payback and savings by starting a request at /get-my-quote/. There’s no obligation, and the information you get will be far more accurate than any generic state average.